Why Energy Will Decide the Future of AI Infrastructure
ENERGY DOMINANCE · WEEK 18, PART II · APRIL 2026
Power Availability and System Efficiency as the Decisive Competitive Advantage in 2026–2030
Tech Infrastructure | AI Energy Strategy | Strategic Intelligence Brief | René Grywnow, DBA
In every previous compute cycle, the winners were defined by what they built. In the AI cycle, they will be defined by what they can power. The strategic question over the next four years is no longer whether AI workloads will scale, they will. It is whether the energy system on which a given operator depends can scale fast enough to absorb that growth. The companies positioning themselves for 2030 are no longer asking how to buy more power. They are asking how to need less of it per unit of compute output. That inversion is the single most consequential strategic shift in digital infrastructure in a generation.
EXECUTIVE SUMMARY
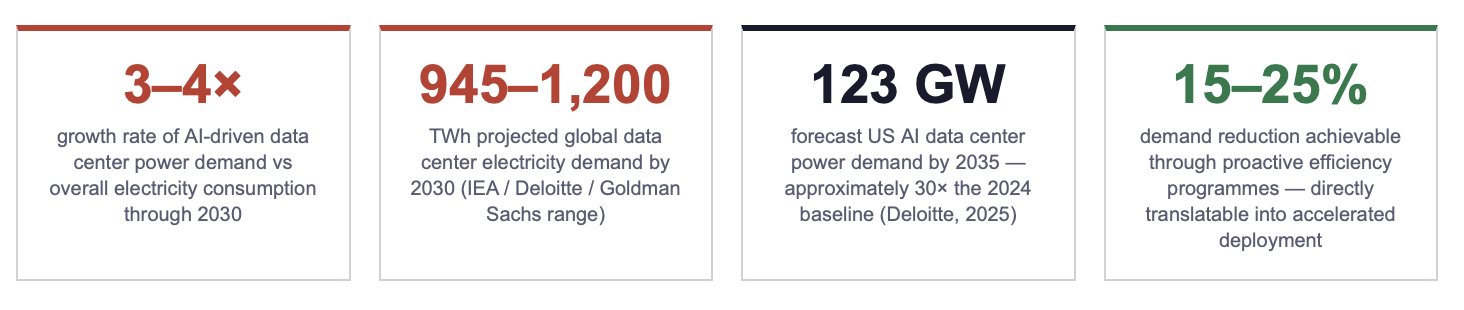
AI-driven data center power demand is projected to grow at 3–4× the rate of overall electricity consumption through 2030. By the end of the decade, global data center load could reach 945–1,200 TWh, with AI servers alone responsible for nearly half of the incremental demand. The growth trajectory exceeds the available pipeline of new generation capacity in every major data center market.
US AI-related data center power demand is forecast to reach 123 GW by 2035, approximately 30× the 2024 baseline. The implication: capacity that takes a decade or more to plan, permit, and build is being demanded on a 24-month deployment cycle. Operators that treat this gap as a procurement problem will lose. Operators that treat it as a system design problem, reducing demand before scaling supply, will dominate.
Infrastructure success in the AI era will be measured in two new units: gigawatts under firm contract, and kilowatt-hours per inference query (or per training token) minimised. Operators who optimise demand first, through system architecture, cooling redesign, and integrated retrofits, achieve superior scalability, lower risk profile, and higher market valuations than peers locked into a buy-more-power posture.
1. The Energy Multiplier in AI Infrastructure
The defining feature of AI infrastructure economics is the multiplicative relationship between compute, energy, and time. A frontier model training run can consume tens of gigawatt-hours over a single training cycle. Inference at scale, once a model is in production, converts what was a discrete training event into a continuous, baseload demand that runs 24 hours a day, 365 days a year. The training curve is steep but bounded. The inference curve is gentler but unbounded, it grows with every user, every query, every embedded model integration across enterprise software.
The combined trajectory has produced demand projections that are no longer comfortably within the capacity-addition pipeline of any major grid. Deloitte's 2025 analysis projects US AI data center power demand reaching 123 GW by 2035, a roughly 30-fold expansion from the 2024 baseline of approximately 4 GW. To put that magnitude in perspective: 123 GW is more than the total installed power capacity of the United Kingdom. It is being demanded by a single segment of a single industry, on a timeline that the relevant utilities and grid operators were not planning for in 2023.
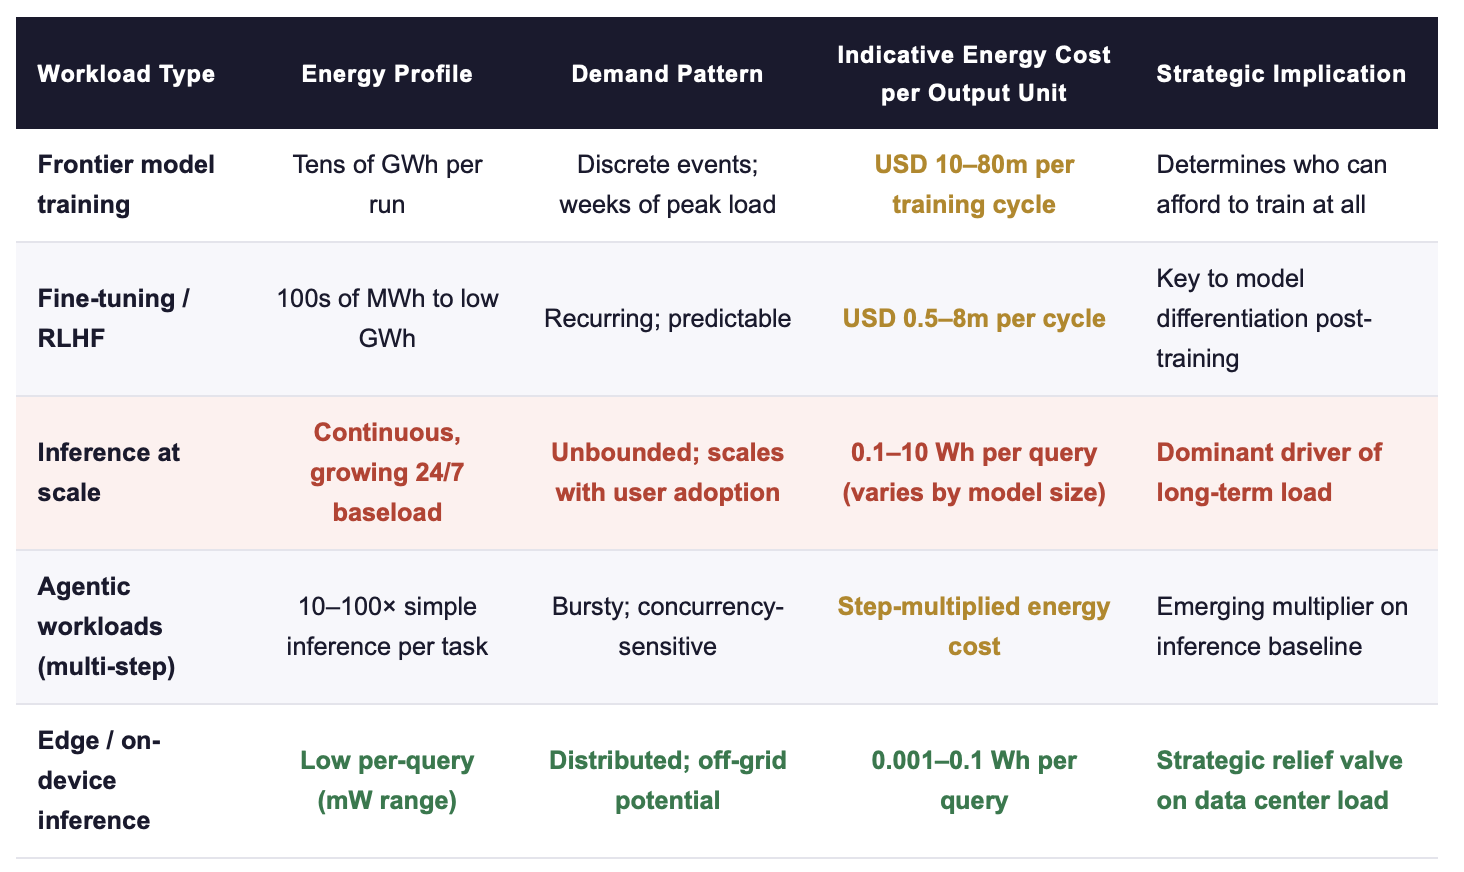
Sources: IEA Energy and AI Report (2025); Deloitte AI Data Centers Power Demand (2025); Goldman Sachs and BCG analyses (2025); industry benchmarks. Energy-per-query figures are indicative and vary substantially by model architecture, prompt length, and hardware generation.
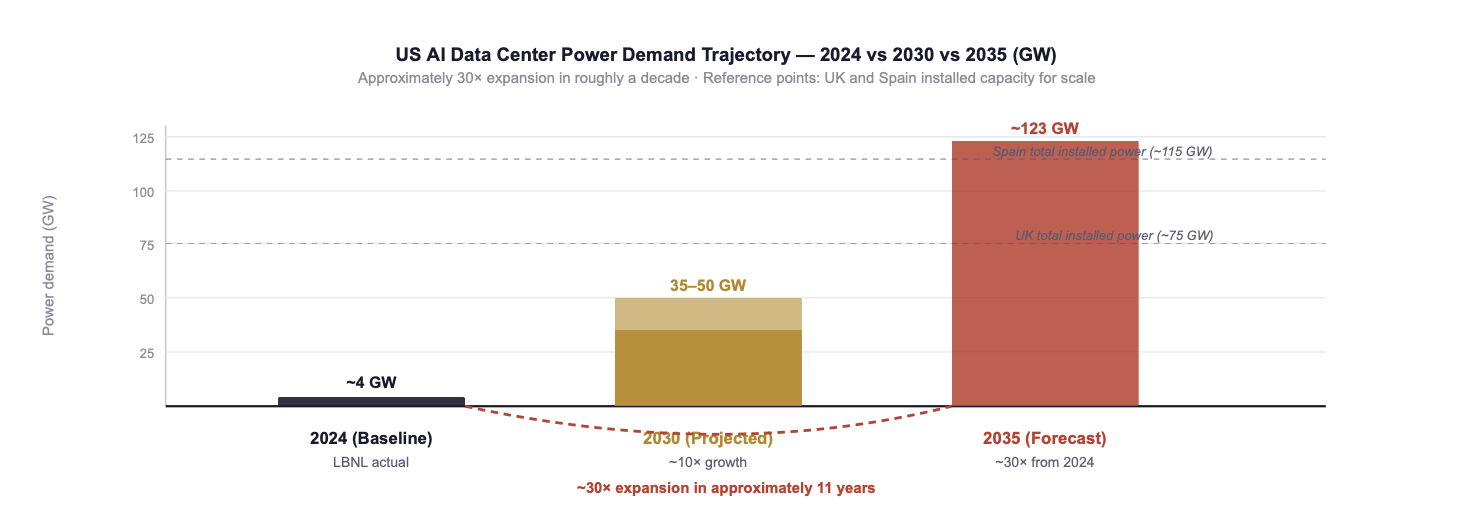
Fig. 1: US AI data center power demand: from approximately 4 GW (2024) to a projected 35–50 GW (2030) to a forecast 123 GW (2035). The 2035 figure exceeds the total installed power capacity of the United Kingdom, for a single segment of a single industry. Sources: Deloitte AI Data Centers Power Demand (2025); LBNL (2024); IEA (2025/2026).
The strategic significance of this chart is not just the magnitude. It is the relationship between the demand curve and the supply curve. Every percentage point of efficiency improvement at the system level, better PUE, smarter workload scheduling, more efficient cooling, denser packaging, directly unlocks more compute output from the same grid connection. In a capacity-constrained environment, efficiency is no longer a sustainability metric. It is a capacity metric. A 10% PUE reduction is not a 10% energy bill reduction; it is a 10% increase in deployable compute on the grid connection that already exists.
👉 Key Insight: Infrastructure success in the AI era will be measured in gigawatts secured under firm contract and kilowatt-hours per output unit minimised, not in FLOPs alone. Every kWh saved through better cooling, smarter scheduling, or denser architecture is a kWh that becomes available for additional compute. In a market where additional grid capacity takes 4–7 years to interconnect, internal efficiency is the only source of additional compute that operates on the AI development timeline rather than the utility planning timeline.
2. From Procurement Mindset to Strategic Energy Management
The traditional response of large infrastructure operators to a demand curve like the one in Fig. 1 is procurement-driven: secure more power, sign more PPAs, build more facilities, accept higher unit costs as the price of growth. This approach is amplifying risk in 2026 in ways that were not visible in 2022. Volatility in wholesale electricity markets, transformer supply constraints, multi-year interconnection queues, and political pressure on grid expansion in residential-adjacent regions have collectively transformed "buy more power" from a viable scaling strategy into a fragile dependency on factors outside the operator's control.
Leading operators have inverted the sequence. Rather than buying more power and then optimising the workload, they design the workload, the facility, and the cooling system to minimise demand, and then procure the reduced demand from a more selective and more strategic energy portfolio. The contrast between the two approaches is now visible in the deployment performance of operators who chose each path two years ago. The procurement-led operators are managing interconnection delays. The system-design operators are energising on schedule.
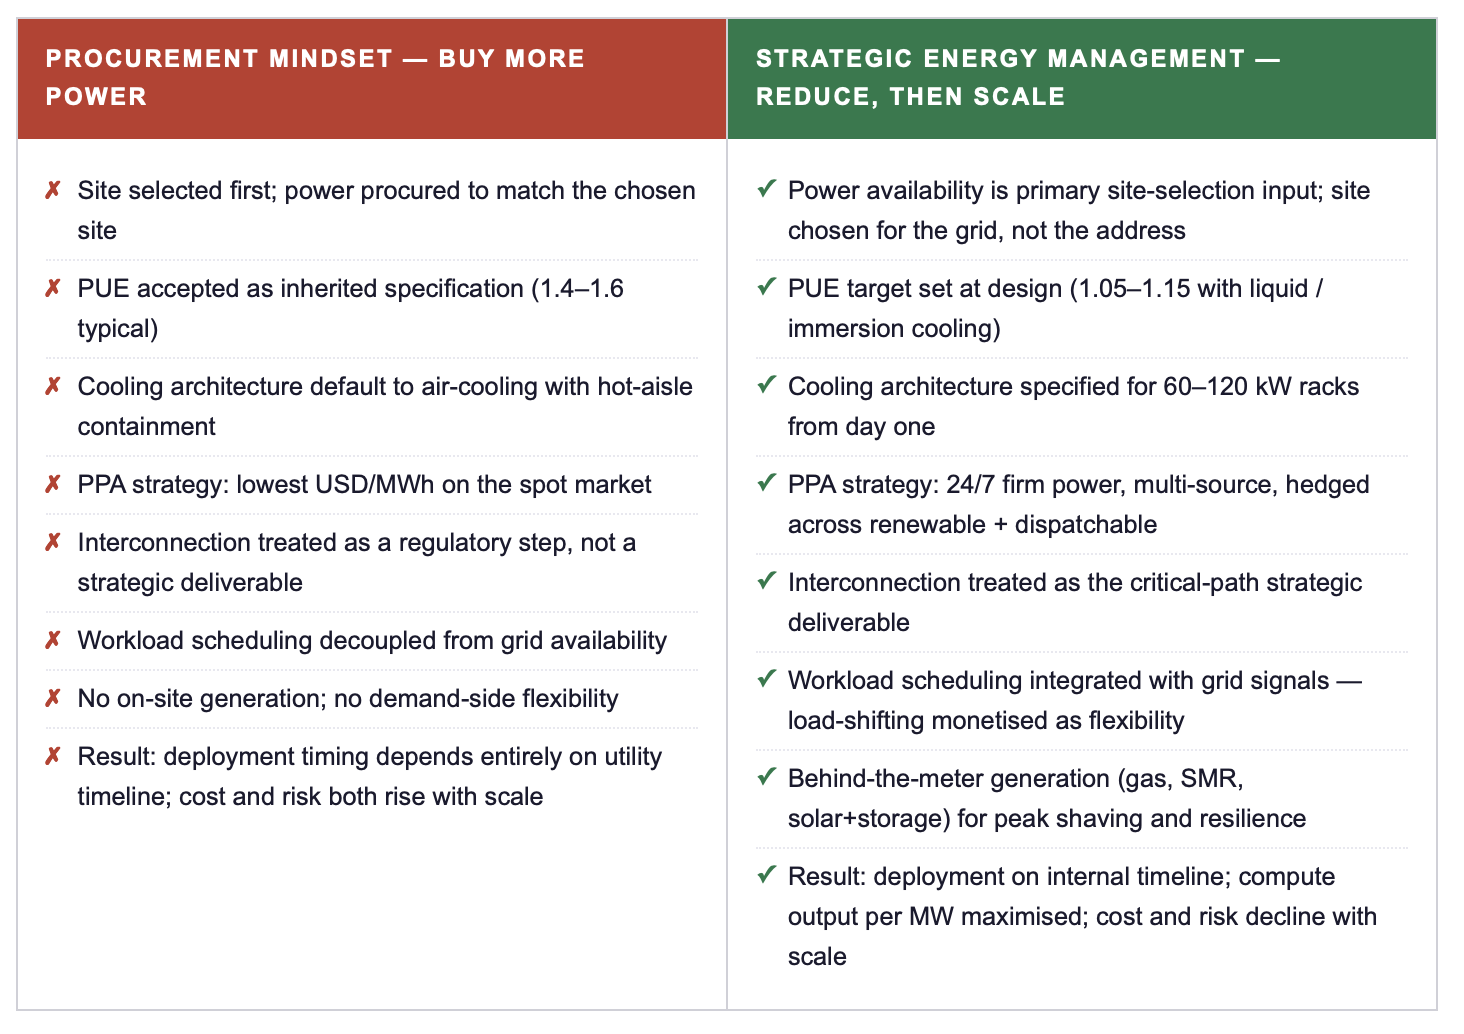
👉 Key Insight: The procurement mindset treats energy as something the operator buys from someone else. Strategic energy management treats energy as something the operator designs, owns, and orchestrates. The first model assumes the grid will scale to meet demand. The second model assumes it will not, and builds the operating model to win in that environment. The difference between the two will be the difference between leading and following in AI infrastructure through 2030.
3. Three Competitive Scenarios for the 2026–2030 Cycle
The strategic positioning available to operators today maps to three observable scenarios, each defined by how the operator treats energy as a competitive variable. The scenarios are not equally accessible at every point in the cycle: Scenario C in particular requires decisions made 24–36 months ahead of capacity energisation, which means the window for the 2028–2030 cohort is closing within the current calendar year.
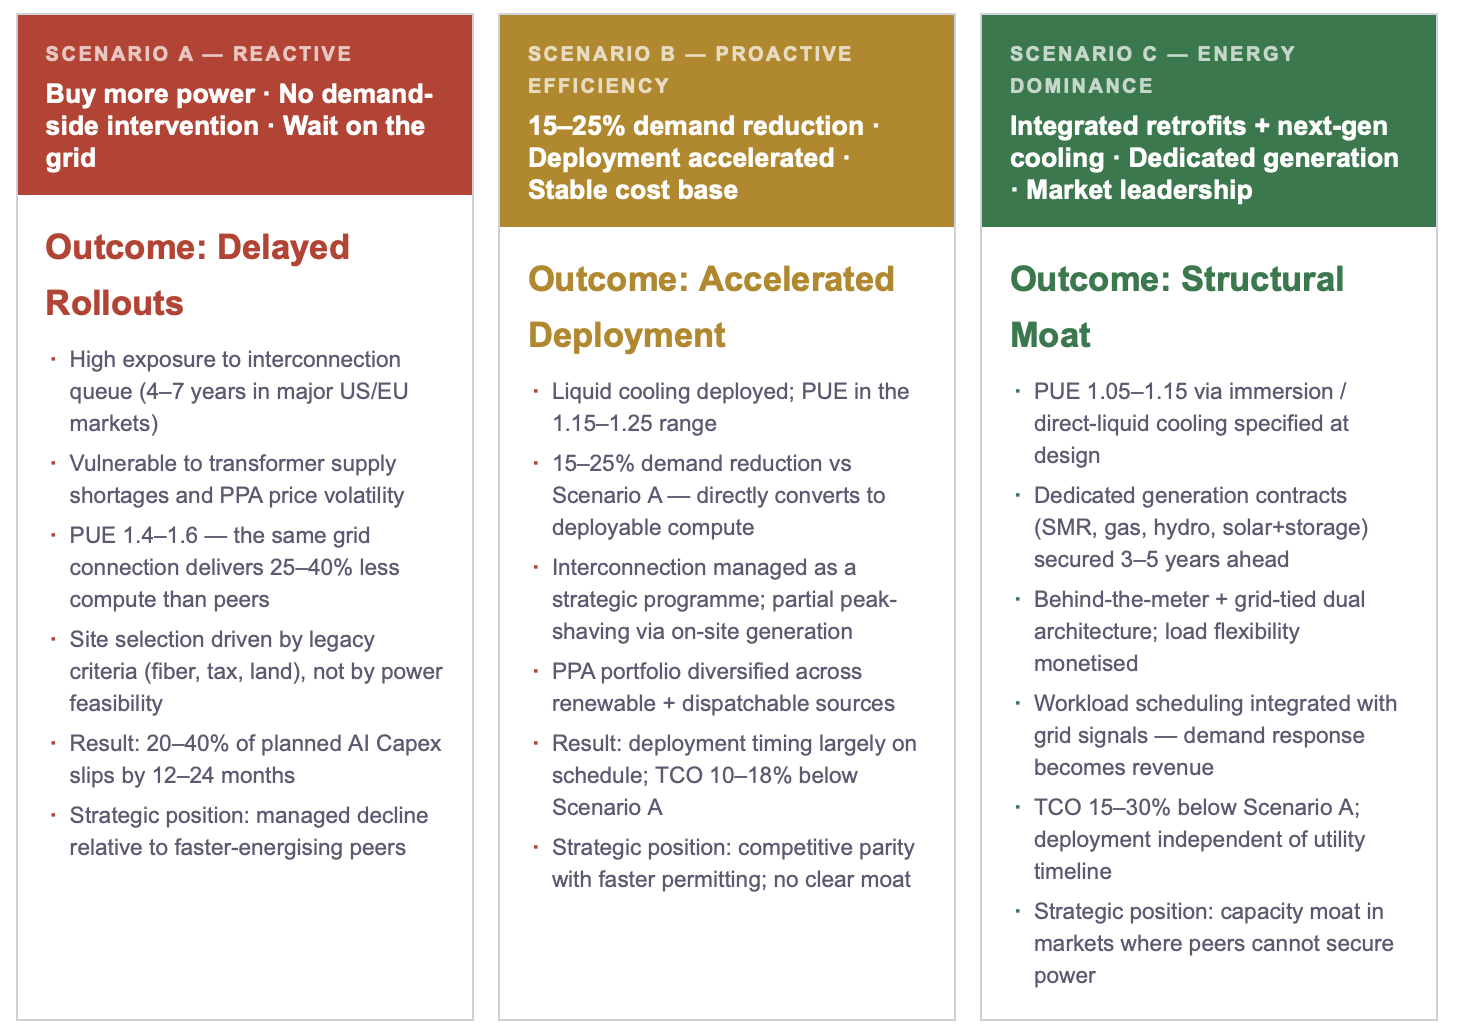
Goldman Sachs and BCG analyses (2025) both confirm the pattern: the operators positioned closest to Scenario C are those who treated 2023–2024 as the window for structural decisions, not as a period of competitive symmetry. The operators positioned in Scenario A are not those without resources, many have larger Capex budgets than the leaders. They are those whose energy strategy was made by procurement and facilities functions rather than at the board level. The strategic difference is not capital. It is governance.
👉 Key Insight: The TCO spread between Scenario A and Scenario C on a 1 GW campus over a 10-year operating horizon is measured in billions of dollars of cumulative cost differential. More importantly, it is measured in whether the AI product roadmap can be executed at all. Energy dominance is no longer a sustainability metric, an efficiency optimisation, or a procurement objective. It is the capital strategy of AI infrastructure for the next decade.
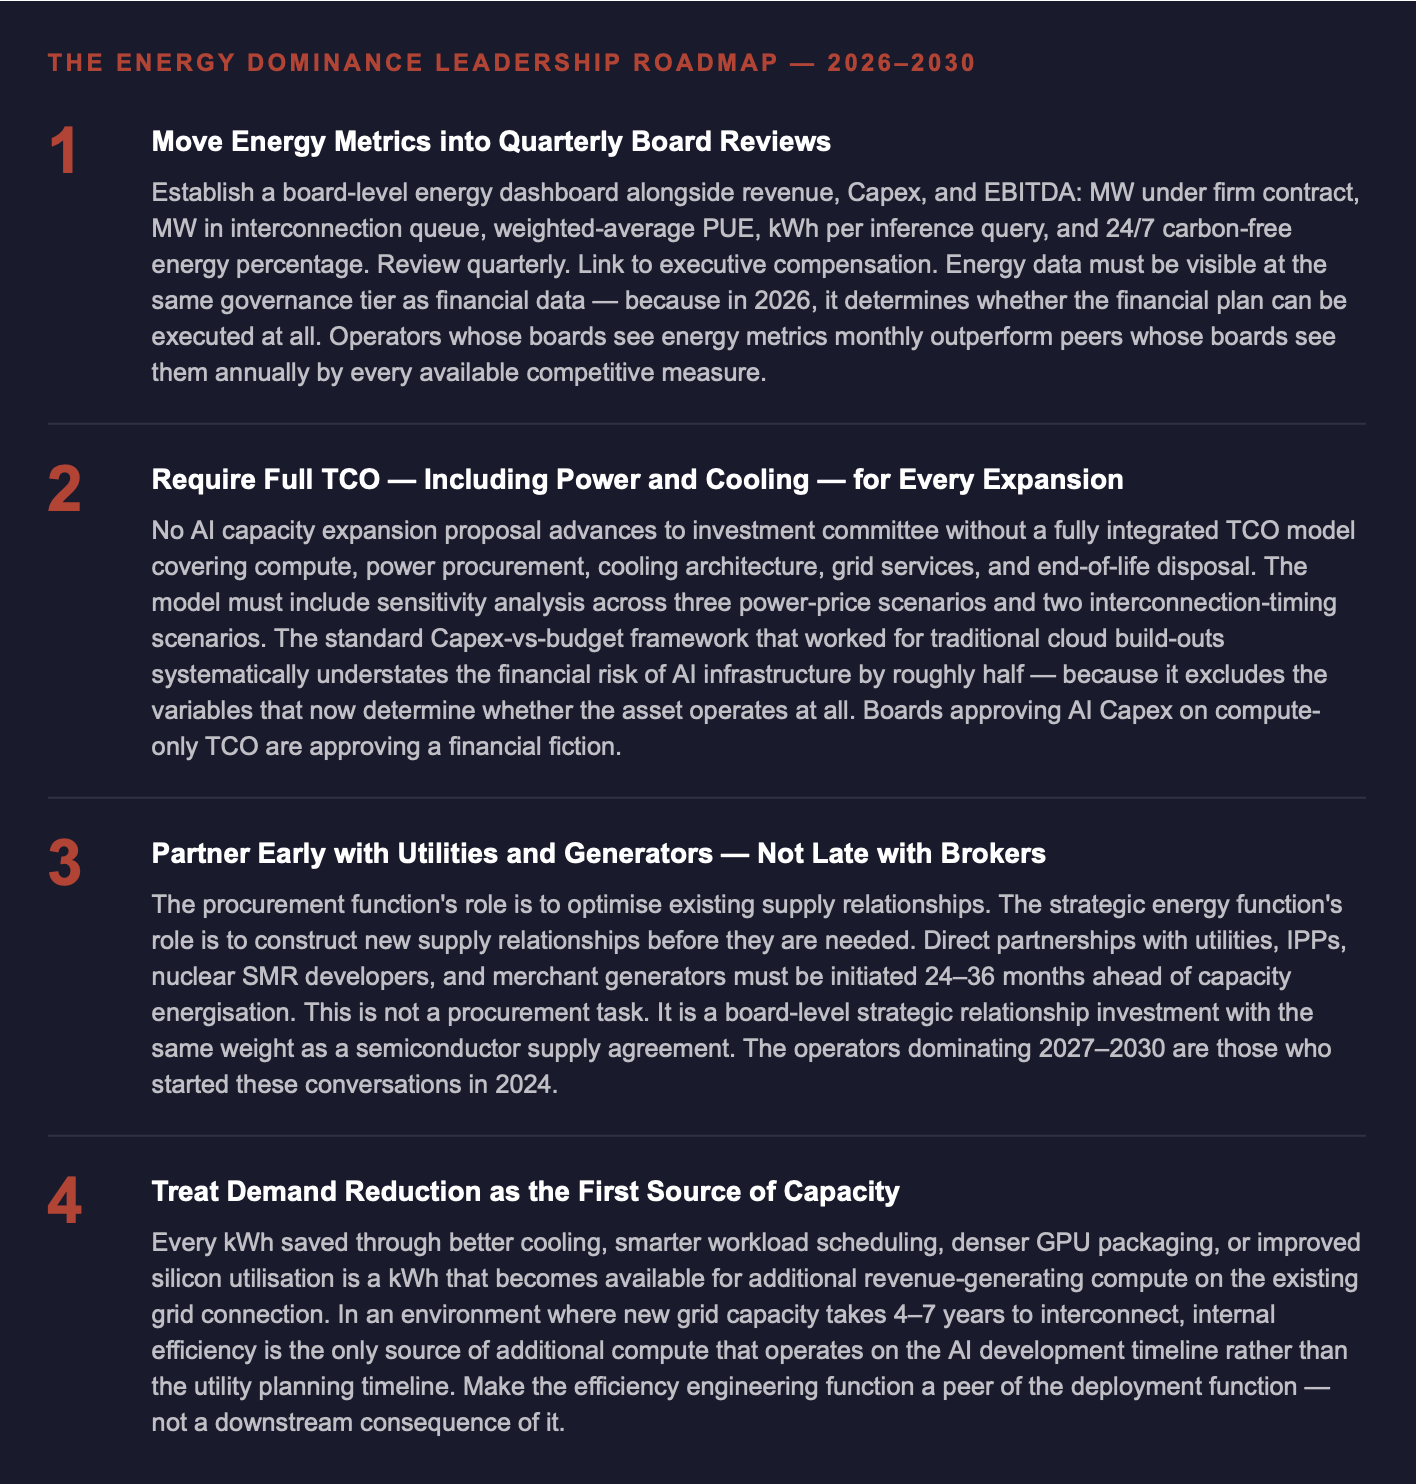
4. The Leadership Roadmap: Four Commitments for 2026–2030
ACTION RECOMMENDATIONS
IMMEDIATE MEASURES (0–90 DAYS)
Build an energy exposure dashboard for the AI Capex pipeline: MW under firm contract, MW in interconnection queue, expected energisation date per site, weighted-average PUE. Present to the board within the next quarterly cycle.
Identify the demand-reduction opportunity: what is the weighted-average PUE across the deployed fleet, and what would a 0.1 reduction translate to in additional deployable compute capacity? This is the single highest-leverage metric for executive attention in 2026.
Stress-test the AI Capex plan against the three-scenario framework (Reactive / Proactive / Dominant): which scenario currently best describes your trajectory, and what specifically would need to change to move one tier higher?
Identify two or three early-stage utility / IPP / generator partnerships that could be initiated in the next 90 days for capacity needed in 2028–2029, the lead time is now sufficient that the 2028 cohort window is open today and closing within months.
STRATEGIC COMMITMENTS (6–24 MONTHS)
Establish a strategic energy function at C-level with authority over PPA portfolio composition, site selection, interconnection pipeline, and cooling architecture, peer to CFO and CTO, reporting directly to the CEO. Energy as a procurement sub-function is the structural failure mode of the procurement-mindset operators.
Mandate integrated TCO modelling for all AI capacity decisions above USD 500m: compute + power + cooling + grid services in a single framework, with sensitivity analysis across power-price and interconnection-timing scenarios.
Lock forward generation contracts for the 2028–2030 deployment cohort within the next 12 months, the lead time on utility-scale 24/7 firm power agreements is now 24–36 months in major markets, and competition for premium counterparties is accelerating.
Build a proprietary efficiency engineering capability, cooling architecture, workload scheduling, silicon utilisation optimisation, as a peer organisation to deployment, not as a downstream sub-function. Internal efficiency is the only capacity source operating on the AI development timeline.
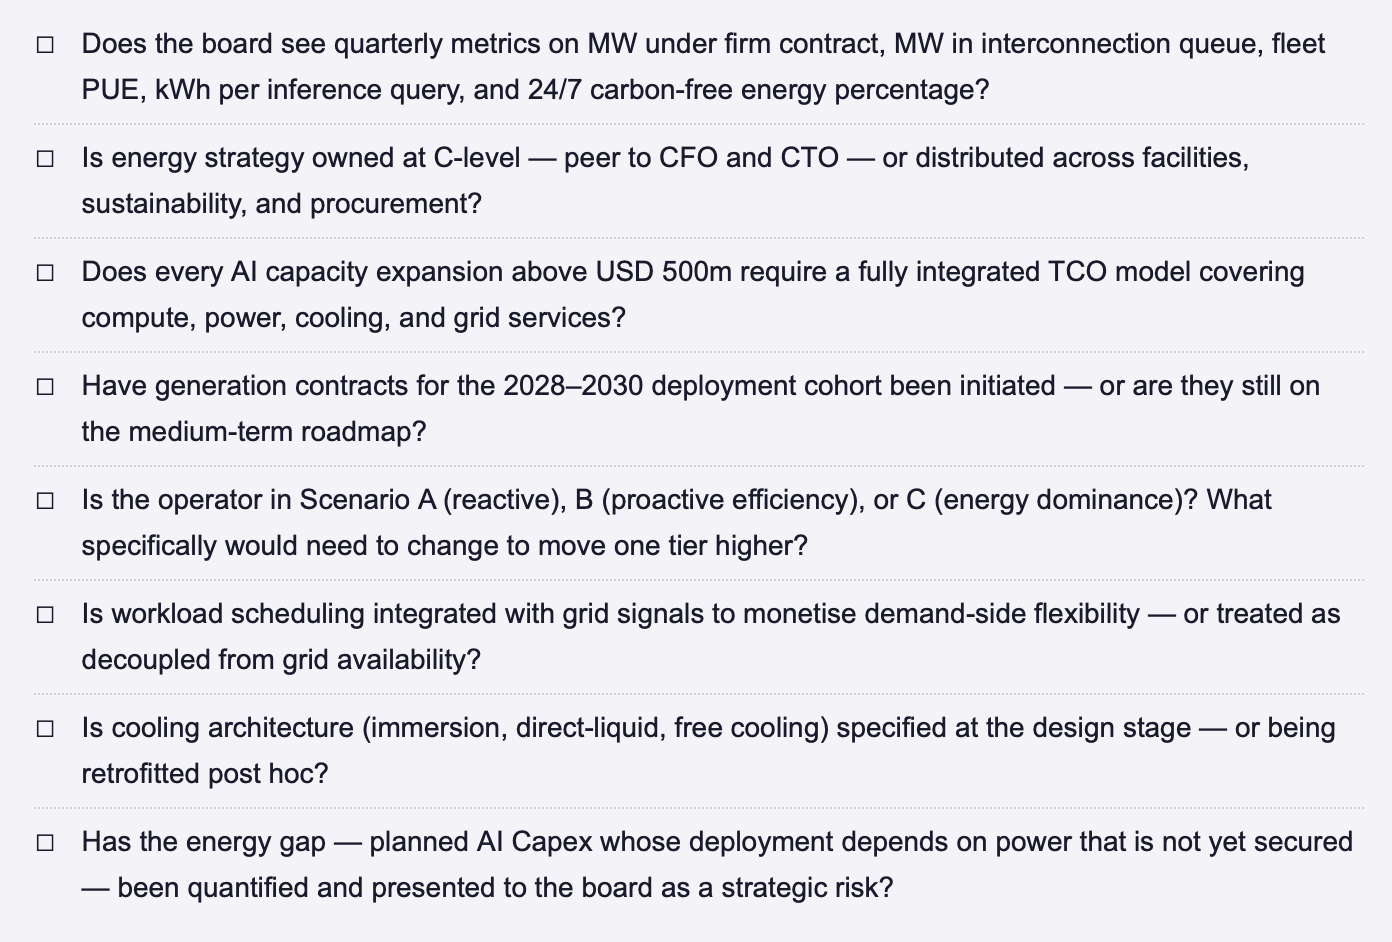
ENERGY DOMINANCE CHECKLIST — STRATEGIC QUESTIONS FOR THE NEXT BOARD MEETING
FINAL THOUGHT
Every previous compute cycle was defined by a binding constraint that was internal to the technology stack: silicon density, network bandwidth, software architecture, capital cost. The AI cycle is the first to be defined by a binding constraint that sits outside the technology stack entirely, in the physical electricity infrastructure that takes a decade to plan and build. Operators who recognise this constraint and re-architect their strategy around it will be the dominant players of 2026–2030. Operators who continue to treat energy as a procurement input will discover, sometime between 2027 and 2029, that their committed Capex cannot be deployed at the pace their AI roadmap requires. The structural choice is being made now, in 2026, by every operator with a 2028–2030 capacity plan. The choice is not whether to invest. It is whether to invest in a system architecture that reduces demand before scaling supply, or in one that buys more power and waits for the grid. Only one of those models is positioned to win.
Where does your organisation currently sit on the procurement-vs-strategy spectrum, and what specifically would need to change at board level to move one tier higher? Connect for a direct exchange or share your current framework. | This post completes Week 18 of the Energy Dominance series. Part I framed why data centers are now an energy problem, not a tech problem. Part II is the strategic response, the leadership decisions that determine whether AI infrastructure investment translates into competitive advantage.
Note: This article reflects my personal views based on industry experience and publicly available information. It does not constitute professional, legal, or investment advice and does not represent the views of my employer.
REFERENCES
BCG (Boston Consulting Group) (2025) The Energy Constraint on AI: Capacity, Capital, and Competitive Position in the 2025–2030 Cycle.Boston: BCG.
Deloitte (2025) AI Data Centers Power Demand: Outlook for the United States, 2025–2035. New York: Deloitte Insights.
Gartner (2025) Forecast: Electricity Demand for Data Centers, Worldwide Trends and Constraints. Stamford, CT: Gartner. November 2025.
Goldman Sachs (2025) Generational Growth: AI, Data Centers, and the Coming US Power Demand Surge. New York: Goldman Sachs Global Investment Research.
IEA (International Energy Agency) (2025) Energy and AI: How the Rise of AI Is Transforming Global Energy Systems. Paris: IEA.
IEA (International Energy Agency) (2026) Data centre electricity use surged in 2025. Paris: IEA. April 2026.
© René Grywnow, DBA · Strategic Intelligence Brief · April 2026 Energy Dominance · Week 18, Part II